
Platform Overview
HOW IT WORKS
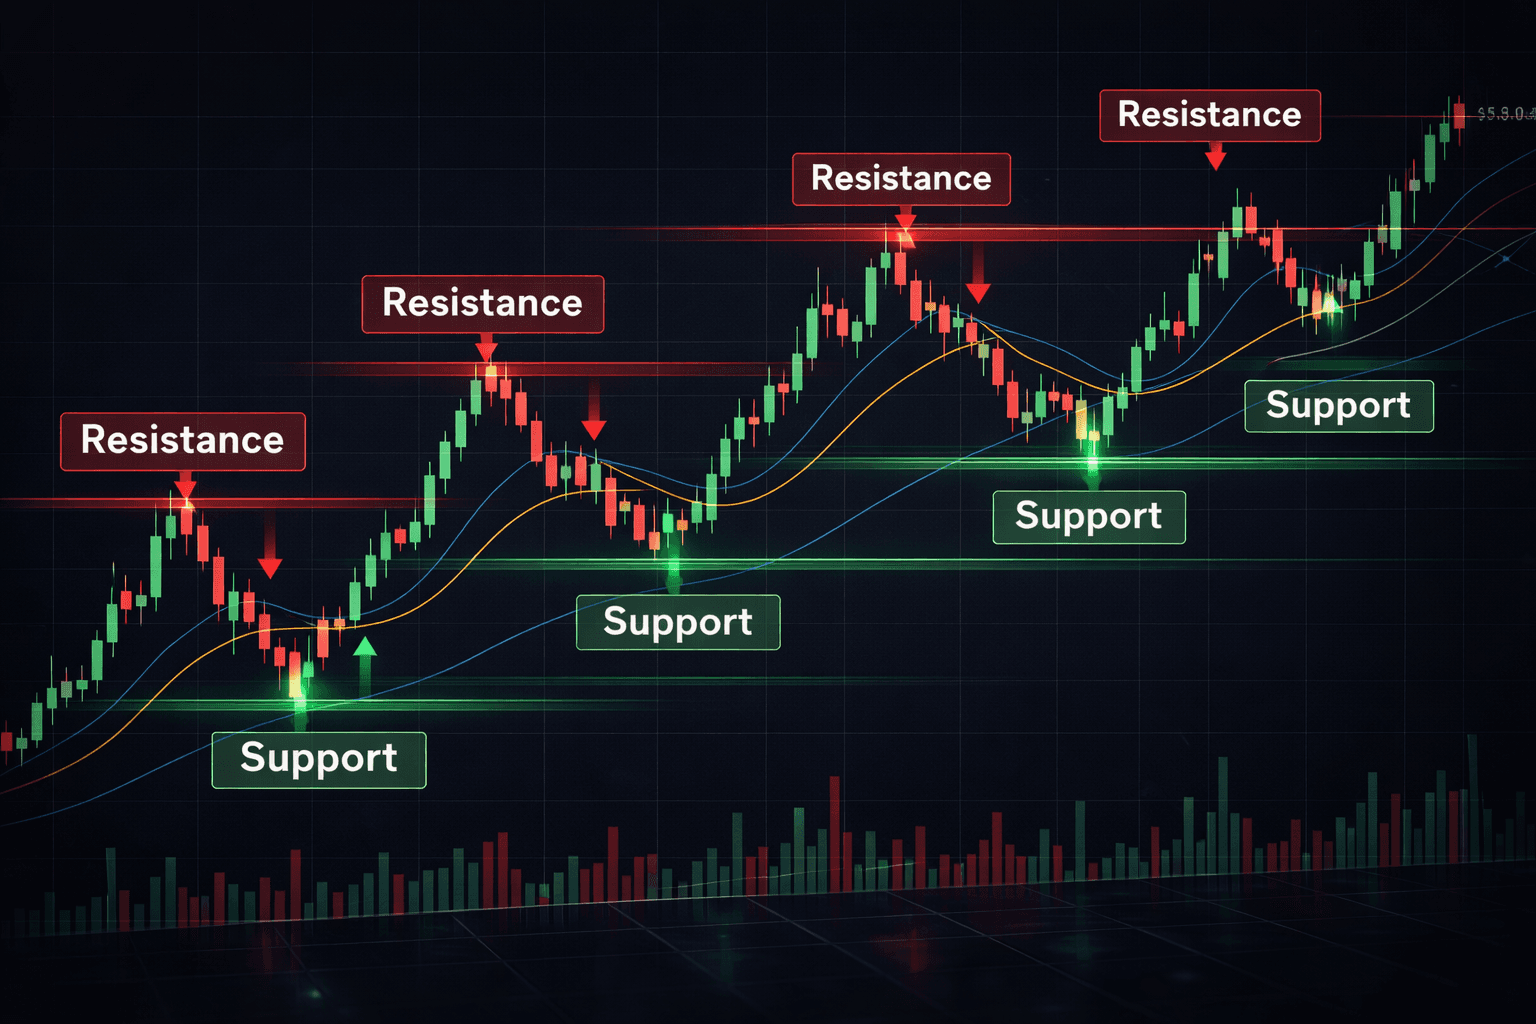
Ideal for both new and experienced traders, the “Visual Assistance” indicator gives a visual representation of high and low values that would be considered horizontal and dynamic support/resistance.
This indicator draws horizontal and dynamic support and resistance
Green = Support
Red = Resistance
Multiple inputs allow for different measurements and color customization
Works on all cryptocurrency, stock, and forex pairs
Runs in REAL TIME on any time frame
Disclaimer: This content is for educational and informational purposes only and is not financial advice. Nothing here is a recommendation to buy or sell any asset or use any platform. Do your own research and manage your risk.
✓
What we loved
- •Clarity & Simplicity
- •Faster Decision-Making
- •Signals appear instantly
✕
Room for improvement
- •Over-Reliance Risk
- •False Signals (Reality of markets)
- •Customization Overload (if poorly designed)